Getting Data into the Anedya Cloud
The quick start guide provides the fastest way to set up your IoT project on the Anedya Platform. However, you should refer to other documentation before going for production deployments
By completing this guide, you'll be able to push the readings fetched from sensors to the Anedya Cloud and visualize data in Node Data Viewer.
Objective
This guide will illustrate a simple yet important aspect of your IoT application, retrieving data from your devices. Specifically, we'll focus on fetching readings from temperature and humidity sensors and transmitting this data to the Anedya Cloud.
Prerequisites
Getting started on the Anedya Platform is very simple. But before we proceed further, there are a few prerequisites:
-
Anedya IoT Cloud Account
Ensure you have an account with the Anedya IoT Cloud. If not, you can easily sign up here.
The best part? It's completely free, and no credit card is required! -
Hardware Setup
Equip your hardware with internet connectivity and a sensor for interfacing. This guide specifically employs a Raspberry Pi paired with a DHT11 temperature and humidity sensor.
Don't have a Raspberry Pi or the sensor? Don't worry! You can still follow this guide. The example code given here also implements a virtual sensor that generates random data points. The only thing that you require is a working Python setup. 🤟
This guide also assumes that you've set up the Raspberry Pi with a working Raspbian release. If not, you can read more here to set up your Raspberry Pi and get it connected to the internet.
This guide uses the Raspberry Pi to have a simple setup and internet connectivity without requiring any additional hardware. However, you are free to use any hardware you want.
Setup project in Anedya Dashboard
Once you have completed signing up for the account, you will be directed to the Anedya dashboard. You can now go ahead and create a new project
Create a New project
Click on New Project to open this dialogue:
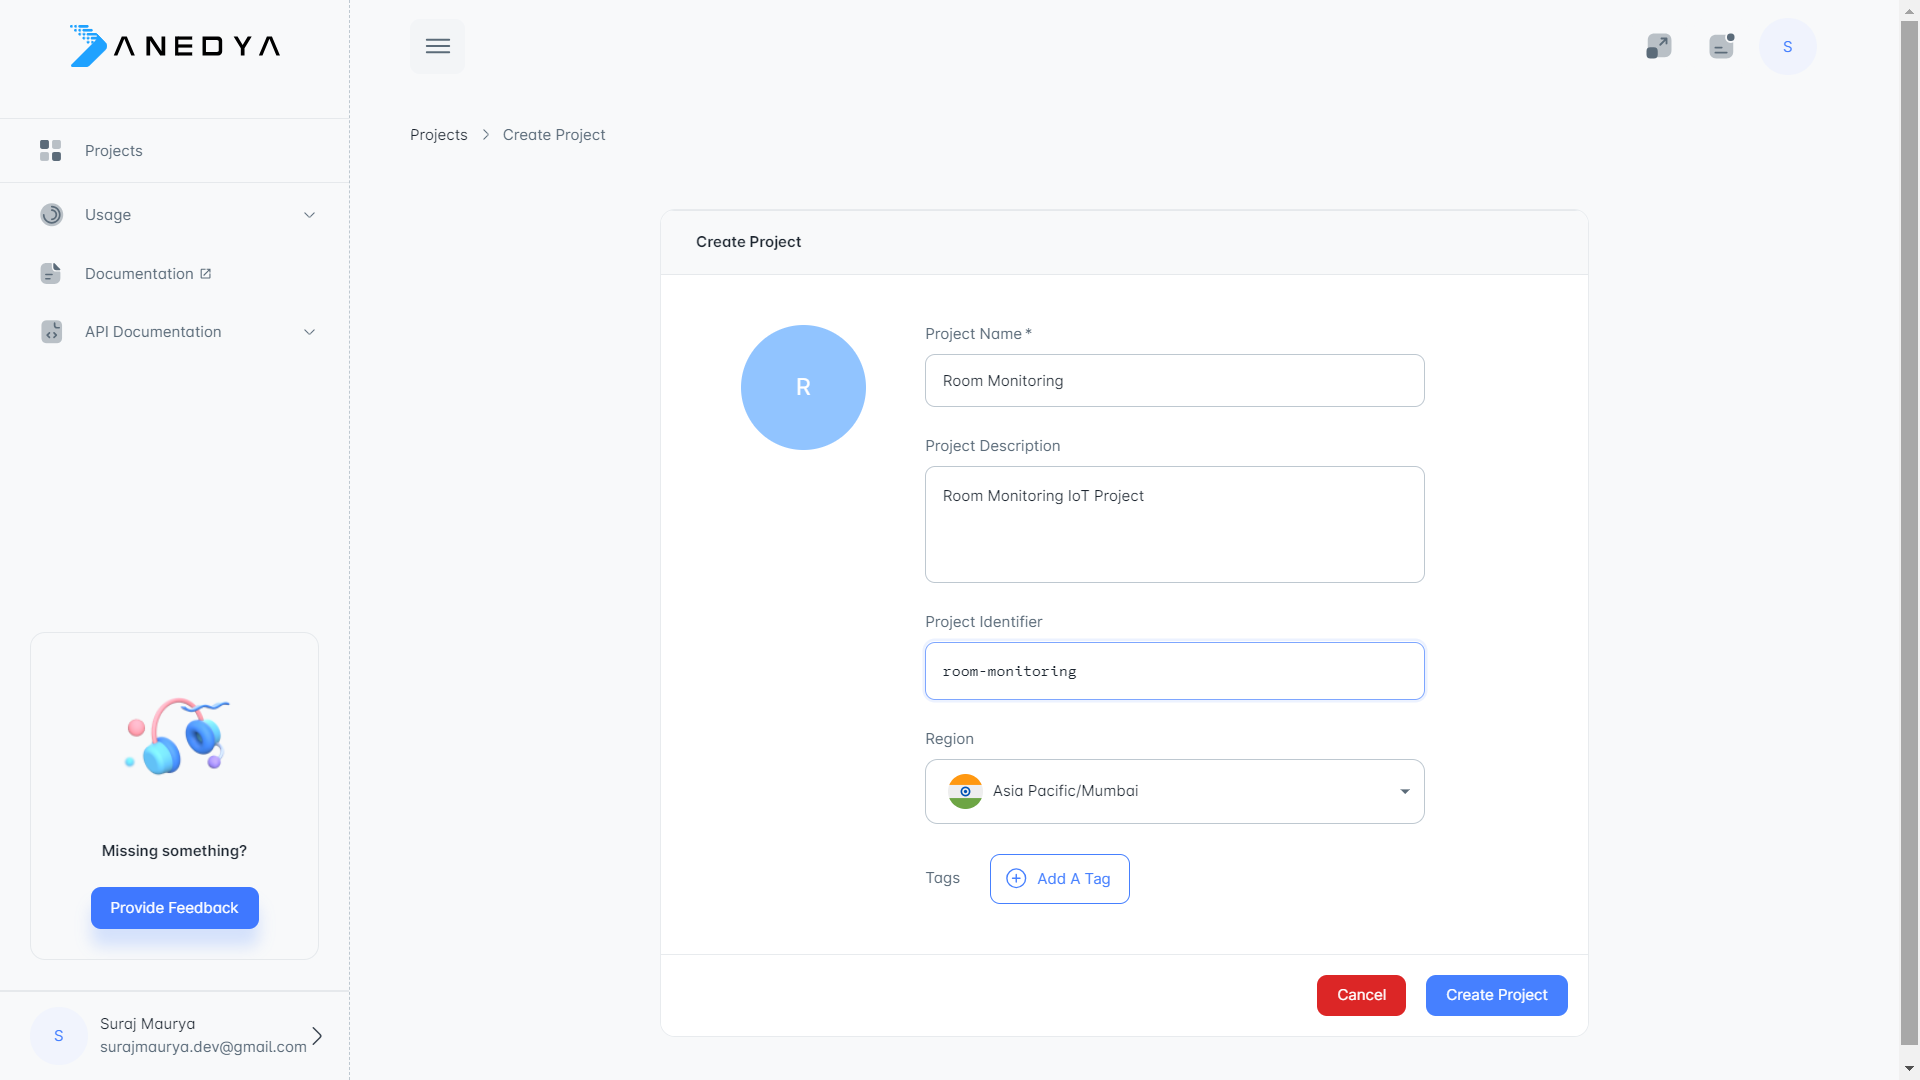
Consider projects as containers where you organize your IoT resources. You can create separate projects for different applications; for instance, you might have one for a humidity measurement product and another for an energy metering purpose. Importantly, resources within each project are entirely segregated from those in other projects and cannot be transferred between them.
Now, provide your project with a meaningful name and description — in this case, let's call it "Room Monitoring". As for the next entry, Project Identifier, leave it blank for now. It proves valuable when interacting with this project through APIs, but for this guide, we'll exclusively use the Anedya dashboard.
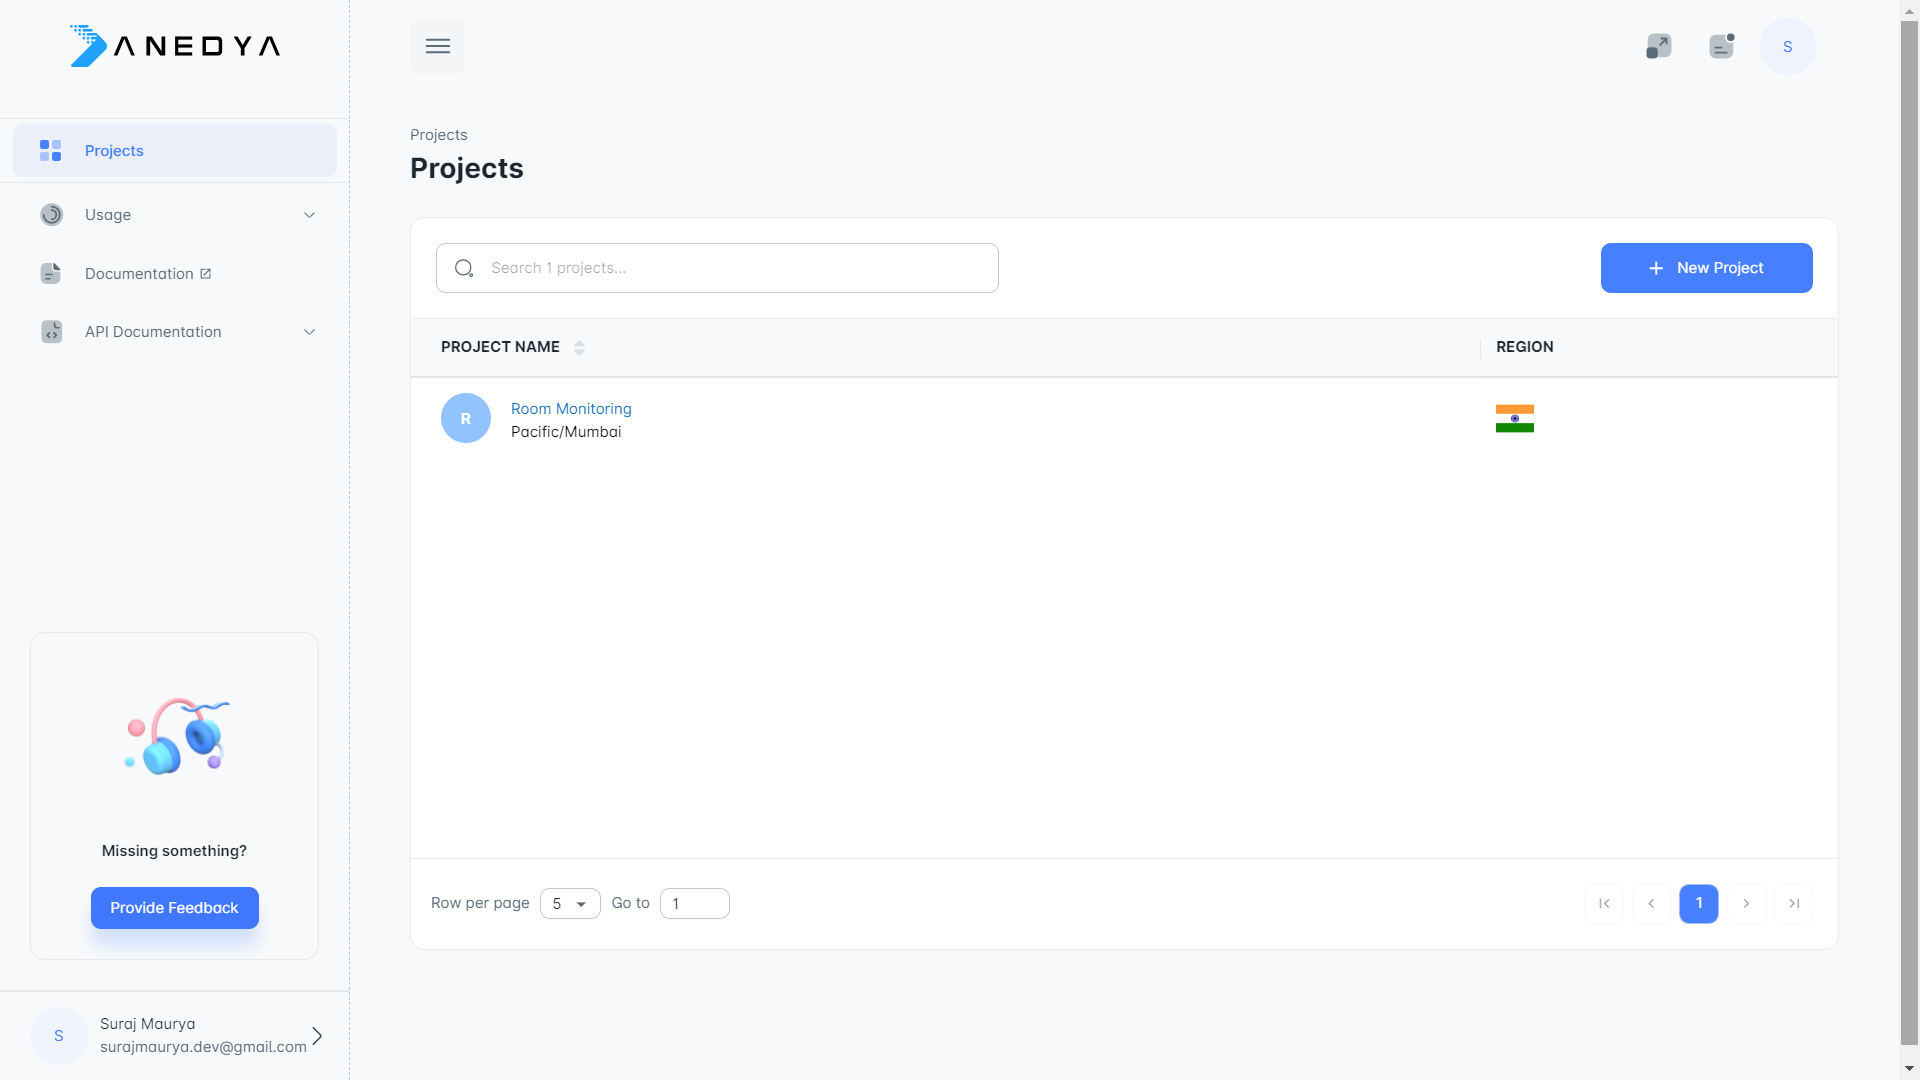
Once the project is created, navigate to the project dashboard by clicking on its name in the list.
Create Variables
In this application, we want to get two readings from our IoT device, one is humidity and the other is temperature. If we manually recorded the readings, it would result in a table like this:
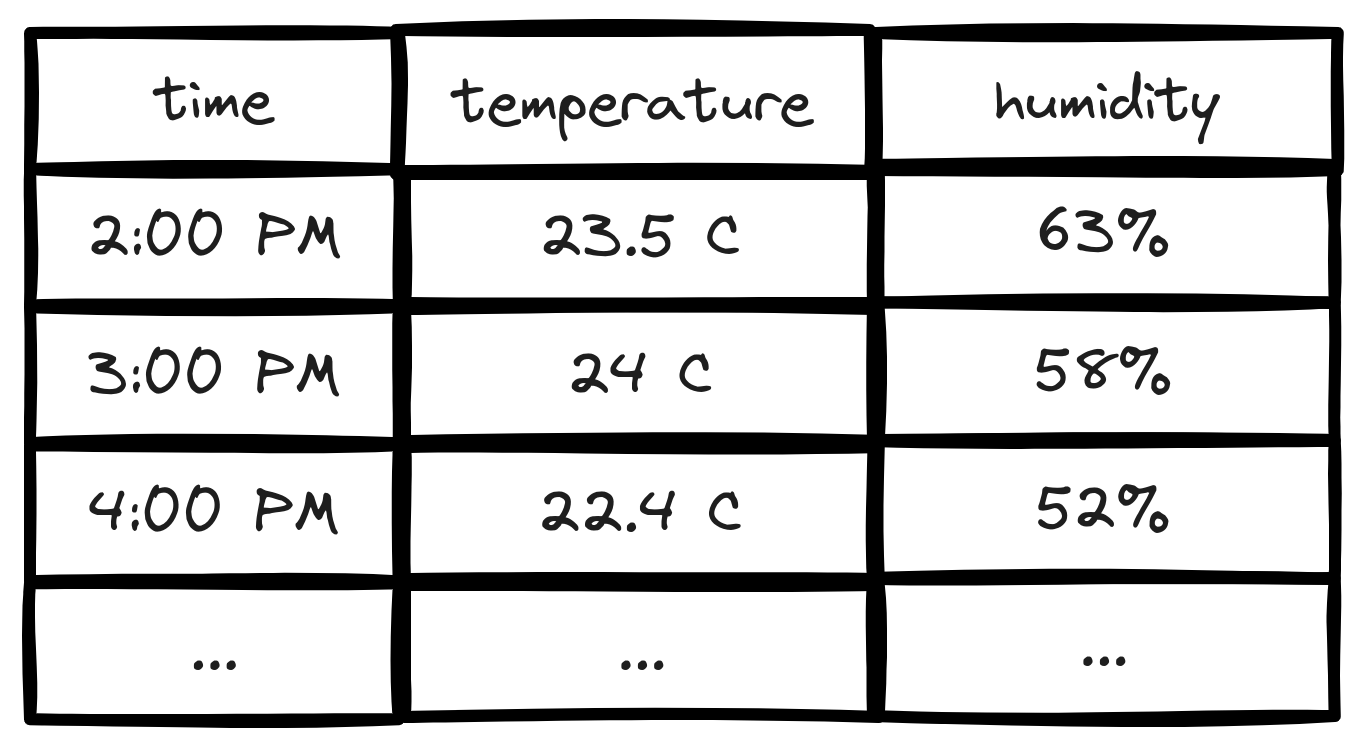
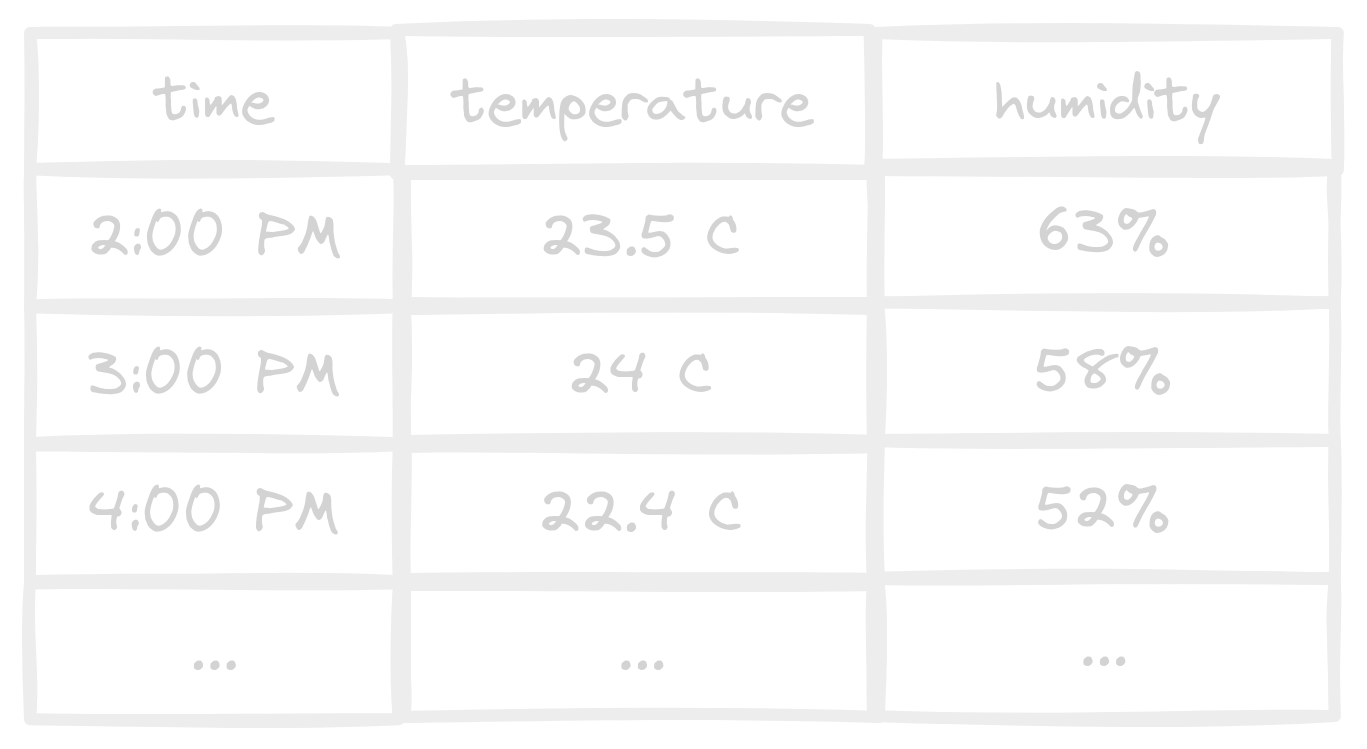
In the above table, temperature and humidity are two columns that store readings for each variable. Similarly, in Anedya, we can create a variable to store the readings for that particular variable. For our application, we will create two variables that will store data for temperature and humidity, respectively.
To create a variable go to the variables section and click new variable:
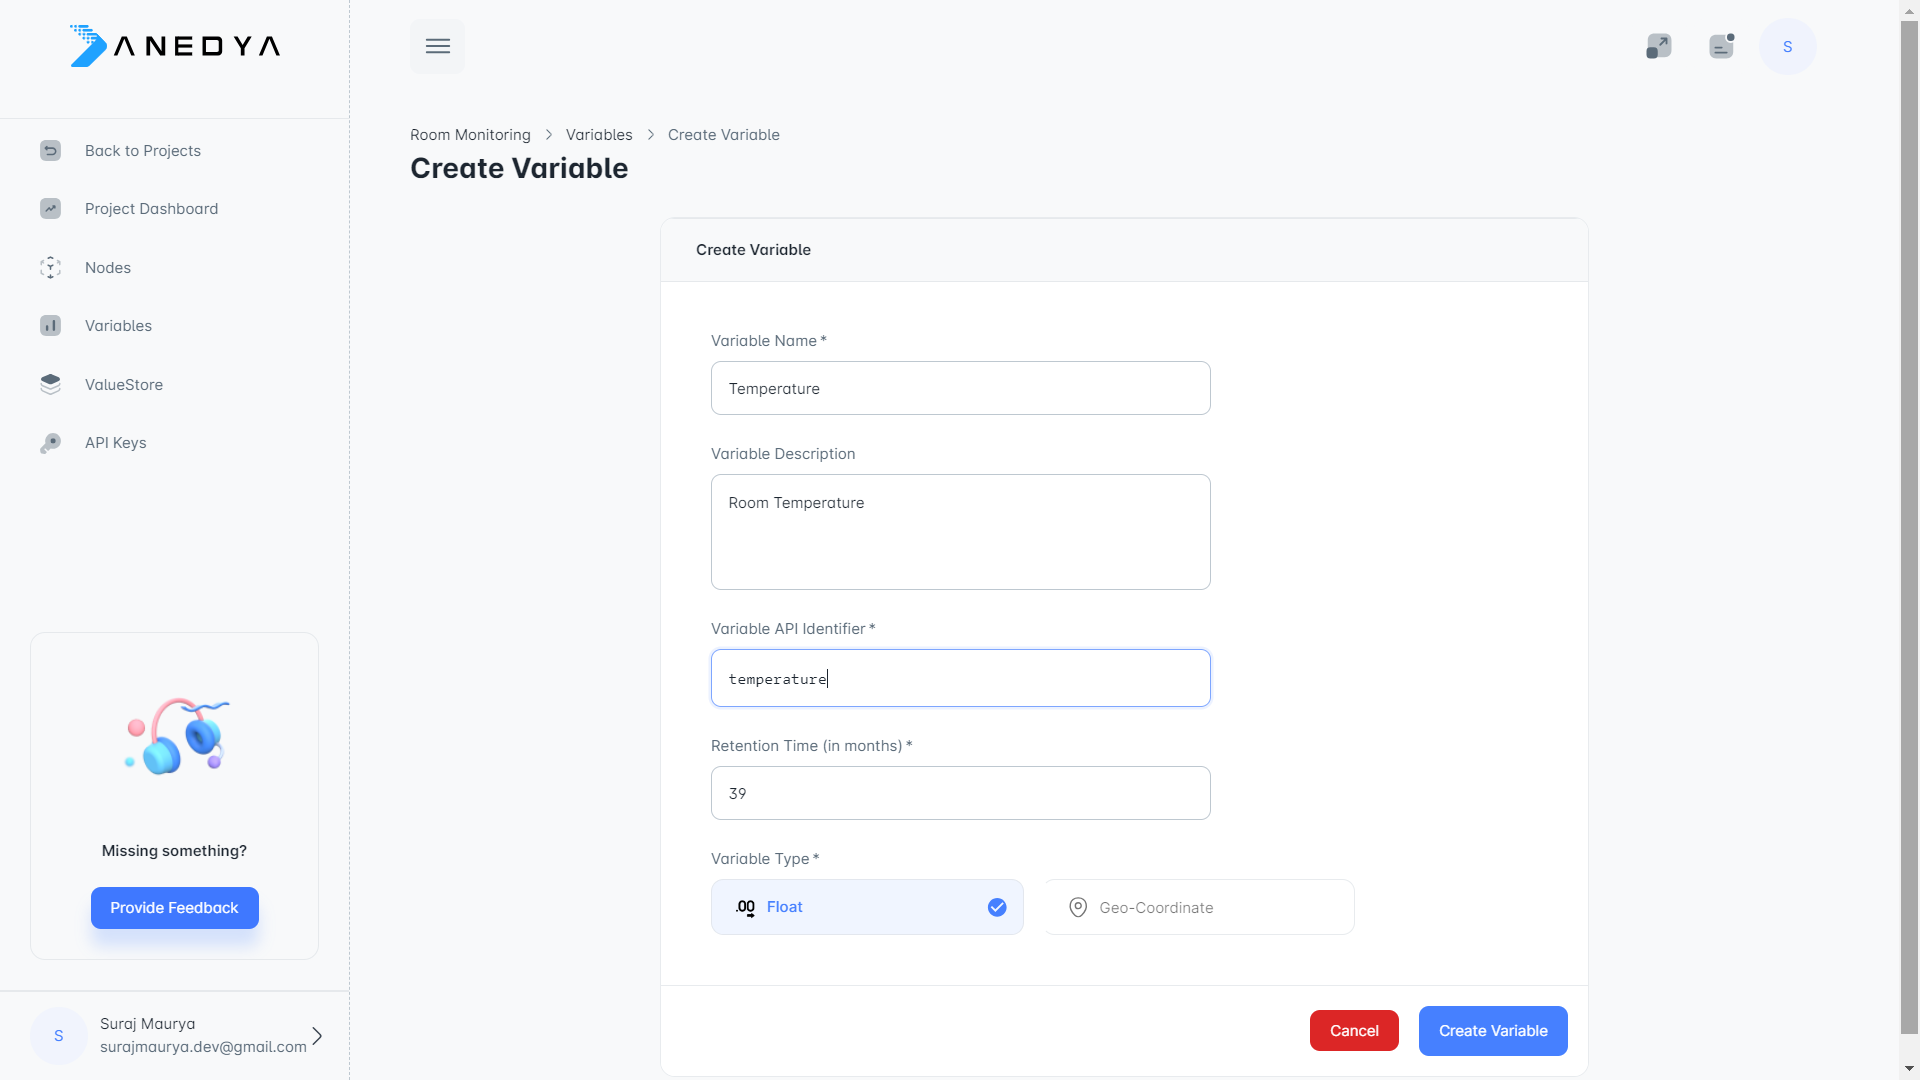
In the dialogue, you will notice two things:
- The variable type is float
- The variable identifier is
temperature
Anedya supports various types of variables like float, geocoordinates, and many more! Each variable type is optimized to store certain types of data and should be used accordingly. Here we are getting readings as a float from the sensor; hence, the float is selected.
In Anedya float has a precision of float32
Also, we need an identifier to be set for this variable. If you don't specify one, the platform will automatically specify one for you, which is the variable ID by default. Please note that you can not change the identifier once a variable is created. We will use this API identifier later in this guide while submitting the readings from the device.
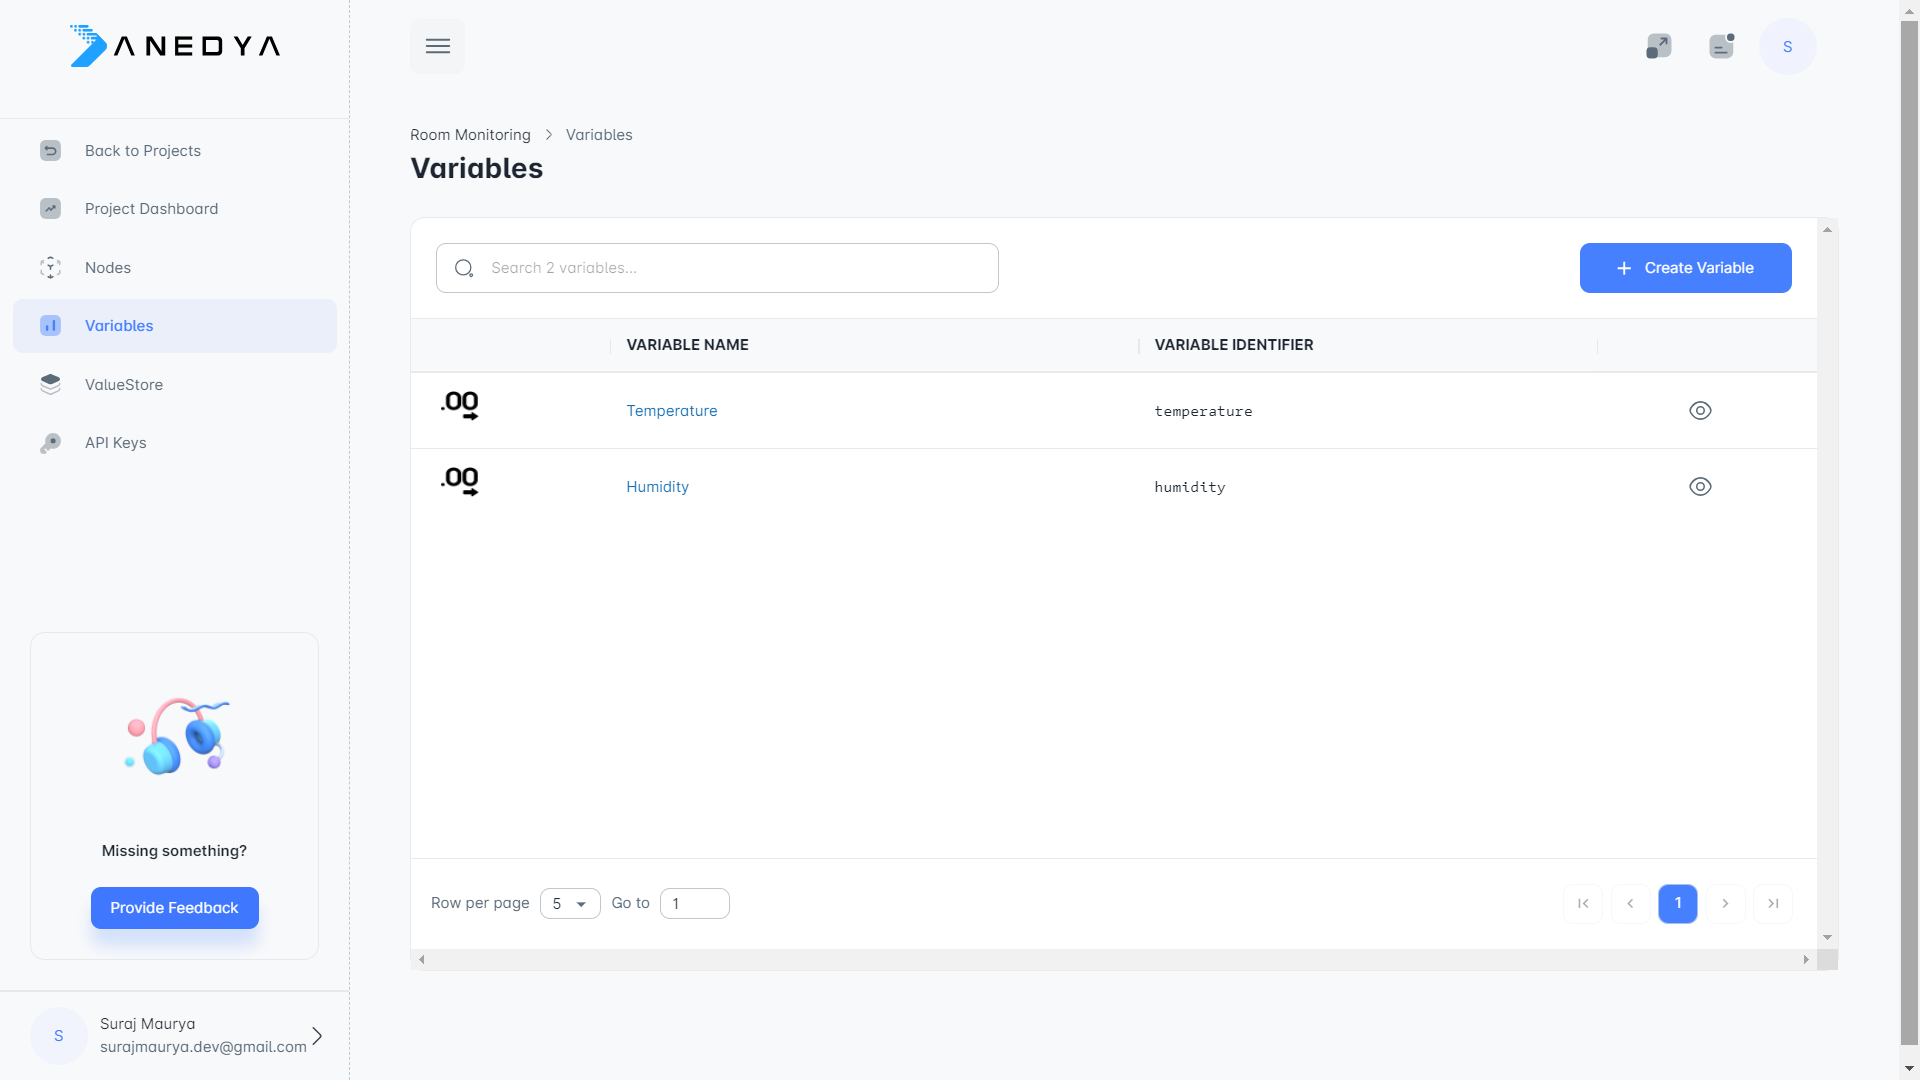
Similarly, create one more variable with the identifier set to humidity. You should now have two variables in your list.
Creating a Node
In the Anedya platform, all your devices are called nodes. Each node acts as a virtual device to which you can bind a physical one. You can bind only one device at a time to a particular node. This design allows you to replace physical hardware without worrying about data submitted by old hardware. have a malfunctioning hardware component, simply replace the hardware and bind it to the same node, and you'll have all of your previous data still available!
In Anedya, each physical device must have a unique UUID fixed for the entire lifespan of the device.
Moving on, let's create a node. Head over to the Nodes section and click Create Node
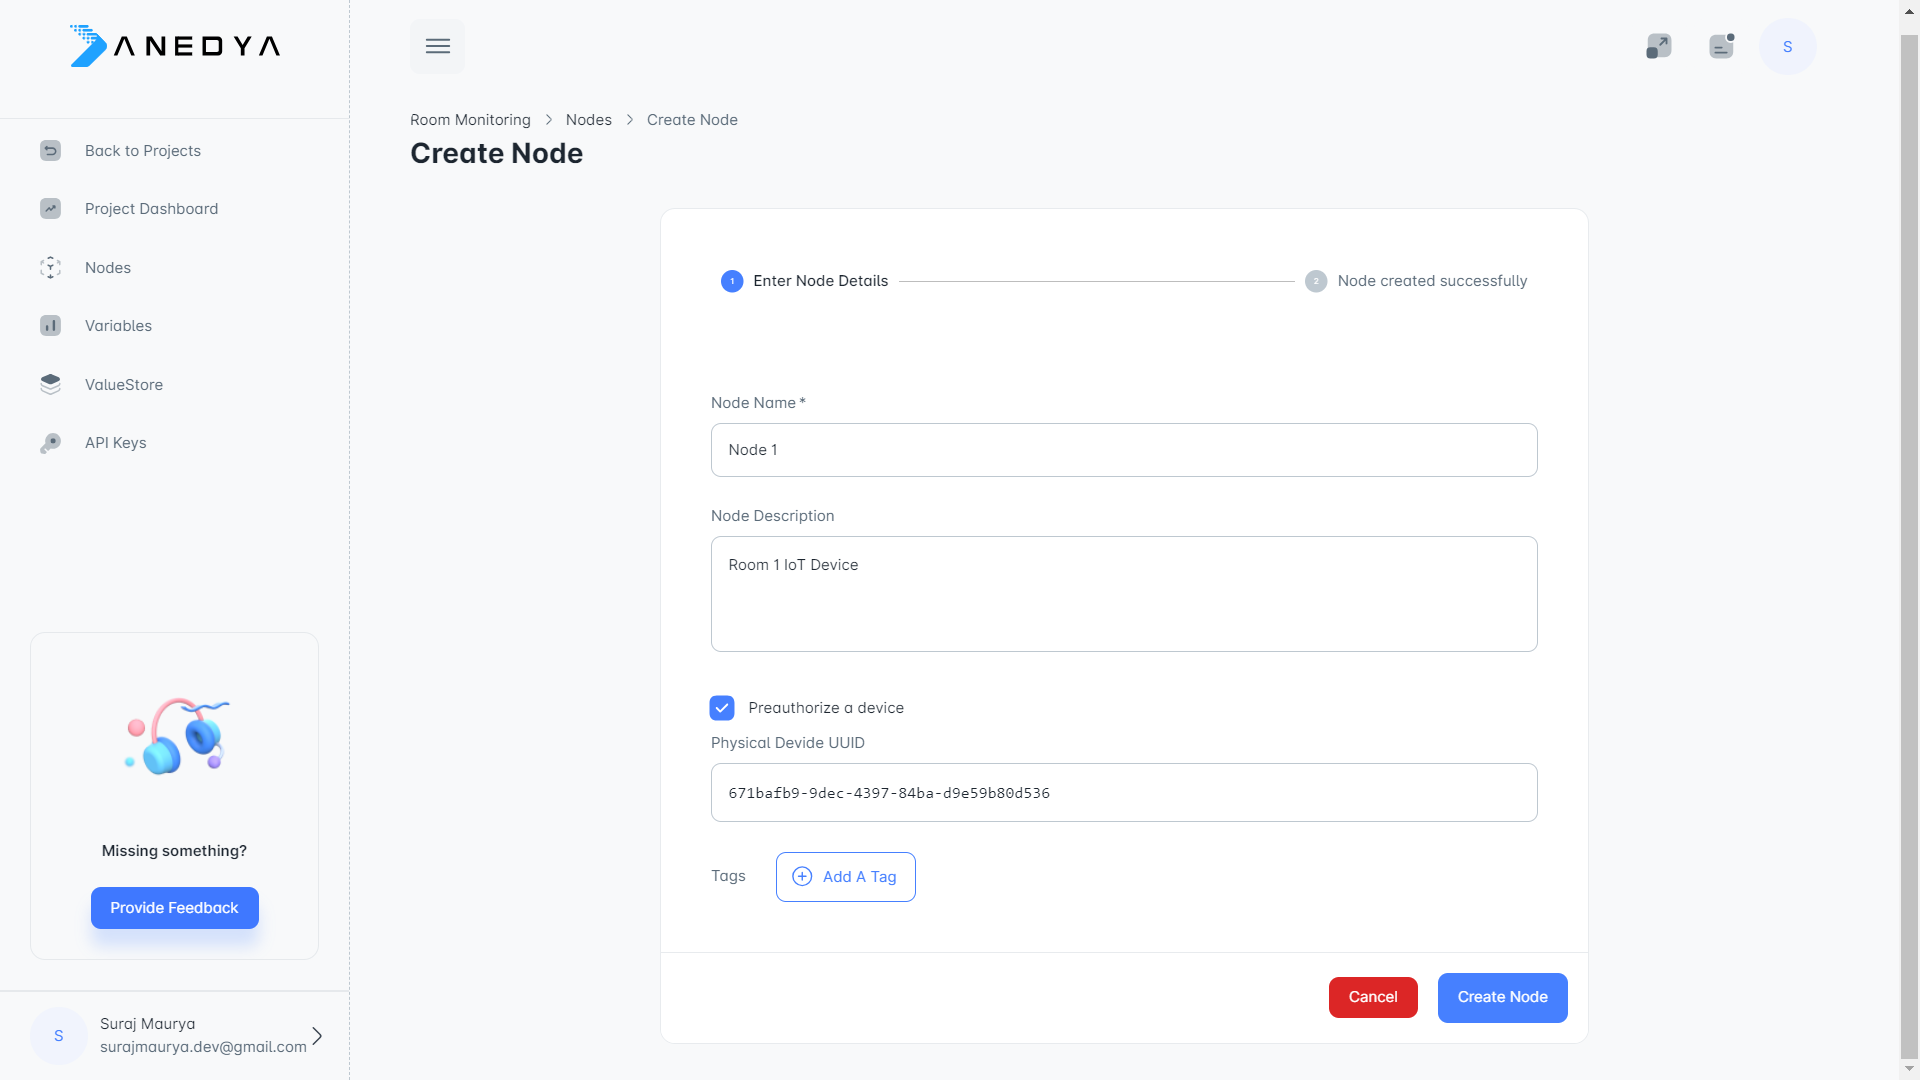
In the above step:
- Node name: Give a name to the node. (For example: Room 1)
- Node Description: Give a short description
- Node API Identifier: Give a short identifier to refer to this node when accessing through API. There is no need to give one right now.
- Physical Device ID: Toggle
Preauthorize deviceto make this field visible. Put a valid UUID on the device. You can generate one here
Please note down the UUID, as we will need it when we work on the hardware part.
Now let's take a break and understand what we mean by pre-authorizing a device. In Anedya you need to bind a physical device to the node before you can push any data. To authenticate a valid device, the Anedya platform needs to know the unique ID by which that particular physical can be identified. There are multiple ways through which you can bind a device to a node in the platform. One way is to provide an ID of the device while creating the node itself. This method allows the elimination of binding flow from the physical device. There'll be other dedicated tutorials about binding a device.
By now, you should have a node displayed in the list. Click on the View Details and you should have a modal containing all the details:
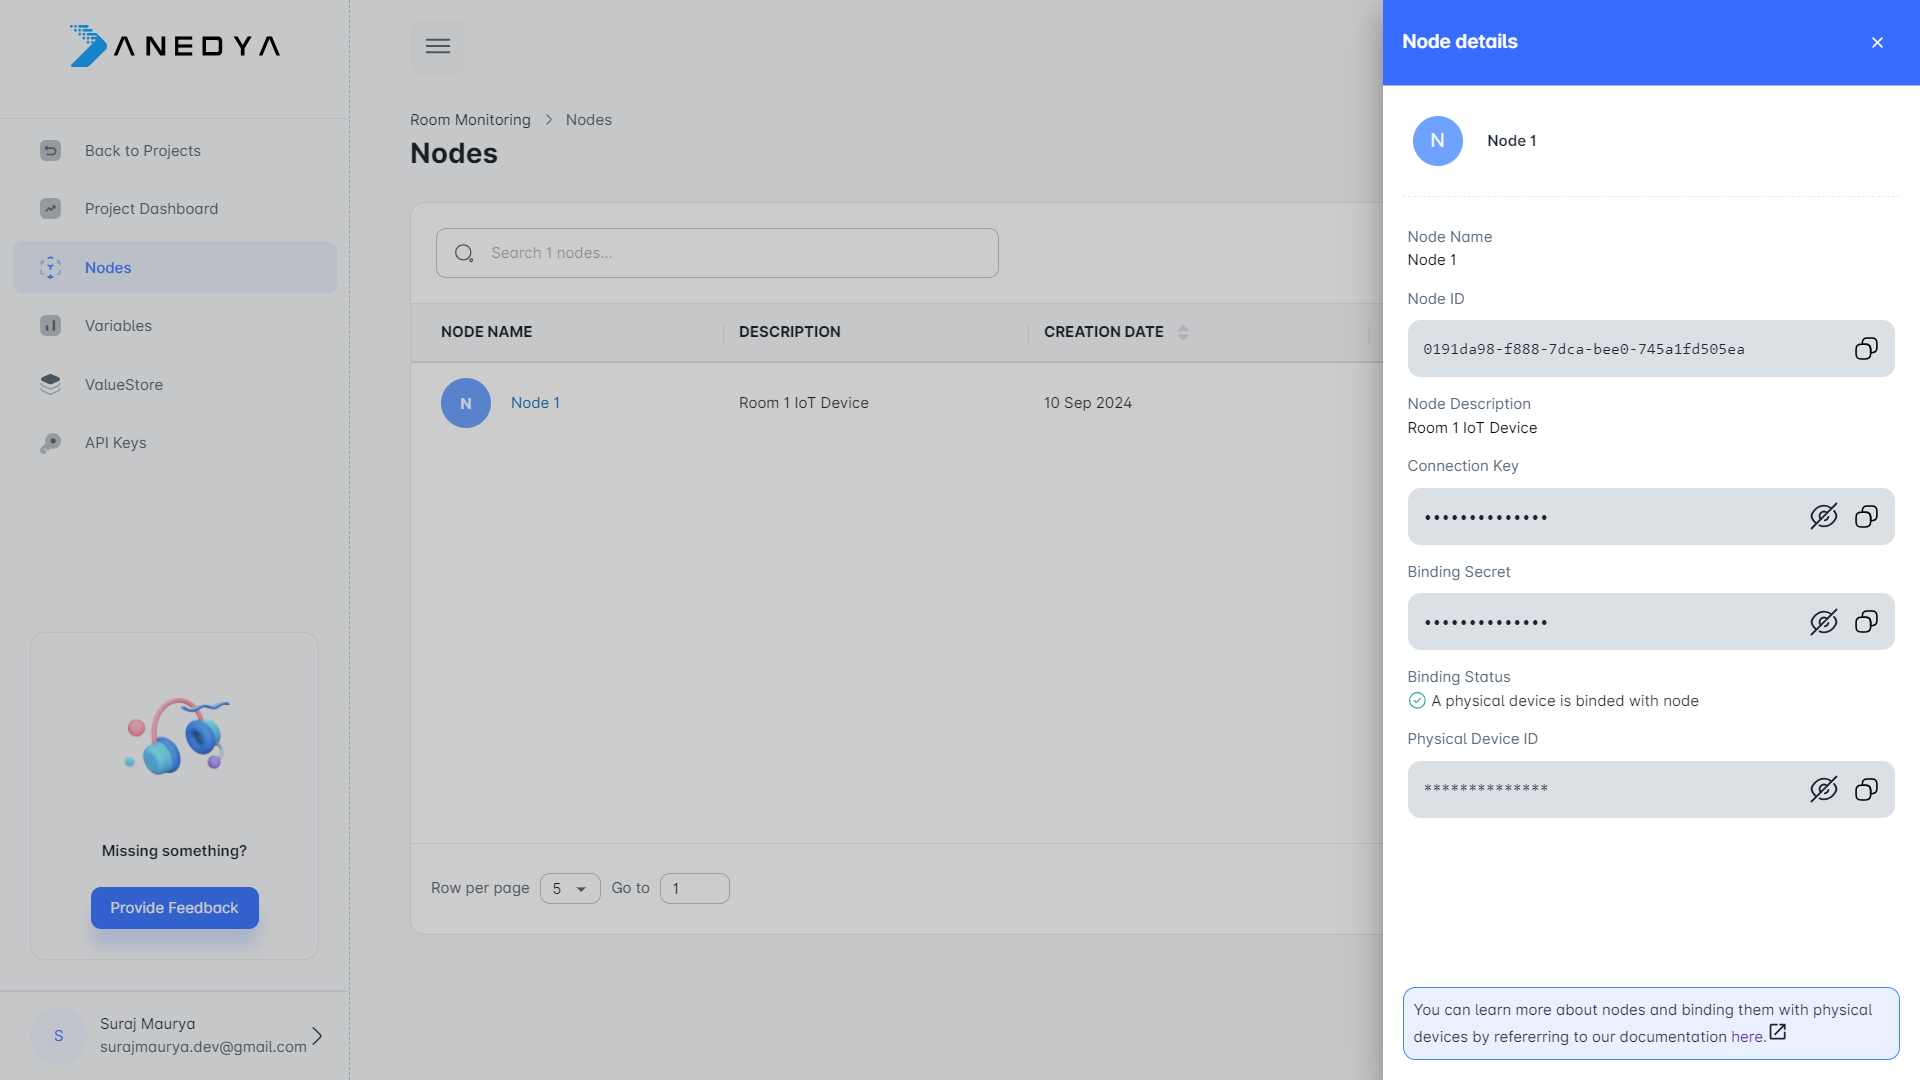
Note the green mark on Binding Status.
Now we have everything in place to get data into the Anedya Platform. It is time to get our hardware ready.
Setting Up Hardware
First, we need a working Raspberry Pi for this application. We will read the data from a DHT11 temperature and humidity sensor and publish it to the cloud.
Let's get started!
Open a terminal in Pi directly or through SSH.
First, we need to get the dependencies to get data from the sensor. Make sure you have all the packages up to date by running:
sudo apt update
sudo apt full-upgrade
sudo apt install python3-pip
sudo pip3 install --upgrade setuptools
sudo reboot
Now we need to set up the DHT11 library developed by Adafruit:
sudo pip3 install --upgrade adafruit-python-shell
wget https://raw.githubusercontent.com/adafruit/Raspberry-Pi-Installer-Scripts/master/raspi-blinka.py
sudo python3 raspi-blinka.py
The script may require updating the Python, and it may ask for a reboot. Reboot the Pi and run the following commands to install the Adafruit package
pip3 install adafruit-circuitpython-dht
sudo apt-get install libgpiod2
and finally, install Anedya's Python SDK for Devices by running:
pip3 install anedya-dev-sdk
You can get more details about SDK at our Github Repository and Python Index Page
Connecting the Hardware
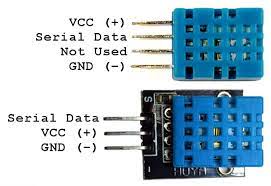
We will be connecting the pins as per the following:
- Vcc Pin → 3.3V Pin on Raspberry Pi
- GND Pin → GND pin of Raspberry Pi
- Serial Data → GPIO23 of Raspberry Pi
Now it is time to code!
Python Code
Download the sample Python code from here and save it in your working directory manually, or you can simply run:
wget https://raw.githubusercontent.com/anedyaio/anedya-dev-sdk-python/main/examples/submitdata_mqtt.py
This example code uses MQTT to connect with the platform. You can also connect using HTTP! You'll find the code for this example using HTTP APIs here
Open the code and we need to modify the following part
# Emulate Hardware Sensor?
virtual_sensor = True
# Set the ID of the physical device
deviceID = '<PHYSICAL-DEVICE-UUID>'
# Set the binding secret for the device
connectionKey = '<NODE-CONNECTION-KEY>'
In the above part if you don't have Raspberry Pi or Sensor available you can keep virtual_sensor=True otherwise set it to False. When it is set to True the example will not interface with hardware and will generate random sensor readings. You can get deviceID and connectionKey from the Node Details dialogue.
Let's have a look at the main part of the code, the rest is just normal stuff.
# Create a configuration object
config = anedya.default_config()
# Set the config parameters
config.setdeviceid(deviceID)
config.setconnection_key(connectionKey)

# Configuration has been set, create an Anedya Client Instance
client = anedya.AnedyaClient()
client.SetConfig(config)
First, we create a configuration object to initialize the SDK client instance. We set the deviceID and bindingSecret.
dp1 = anedya.FloatData(variable='temperature', timestamp=int(time.time()), value=temperature)
dp2 = anedya.FloatData(variable='humidity', timestamp=int(time.time()), value=humidity)

# Append the data in a data store.
data.append(dp1)
data.append(dp2)

# Submit the data to the Anedya Platform
success = client.submit_data(data)
Here, we append the data to a store to submit multiple data points at once. And then we simply submit the data! That's it.
Run the Python code by running python3 ./submitdata_mqtt.py and you should see a success message!
Visualize Data
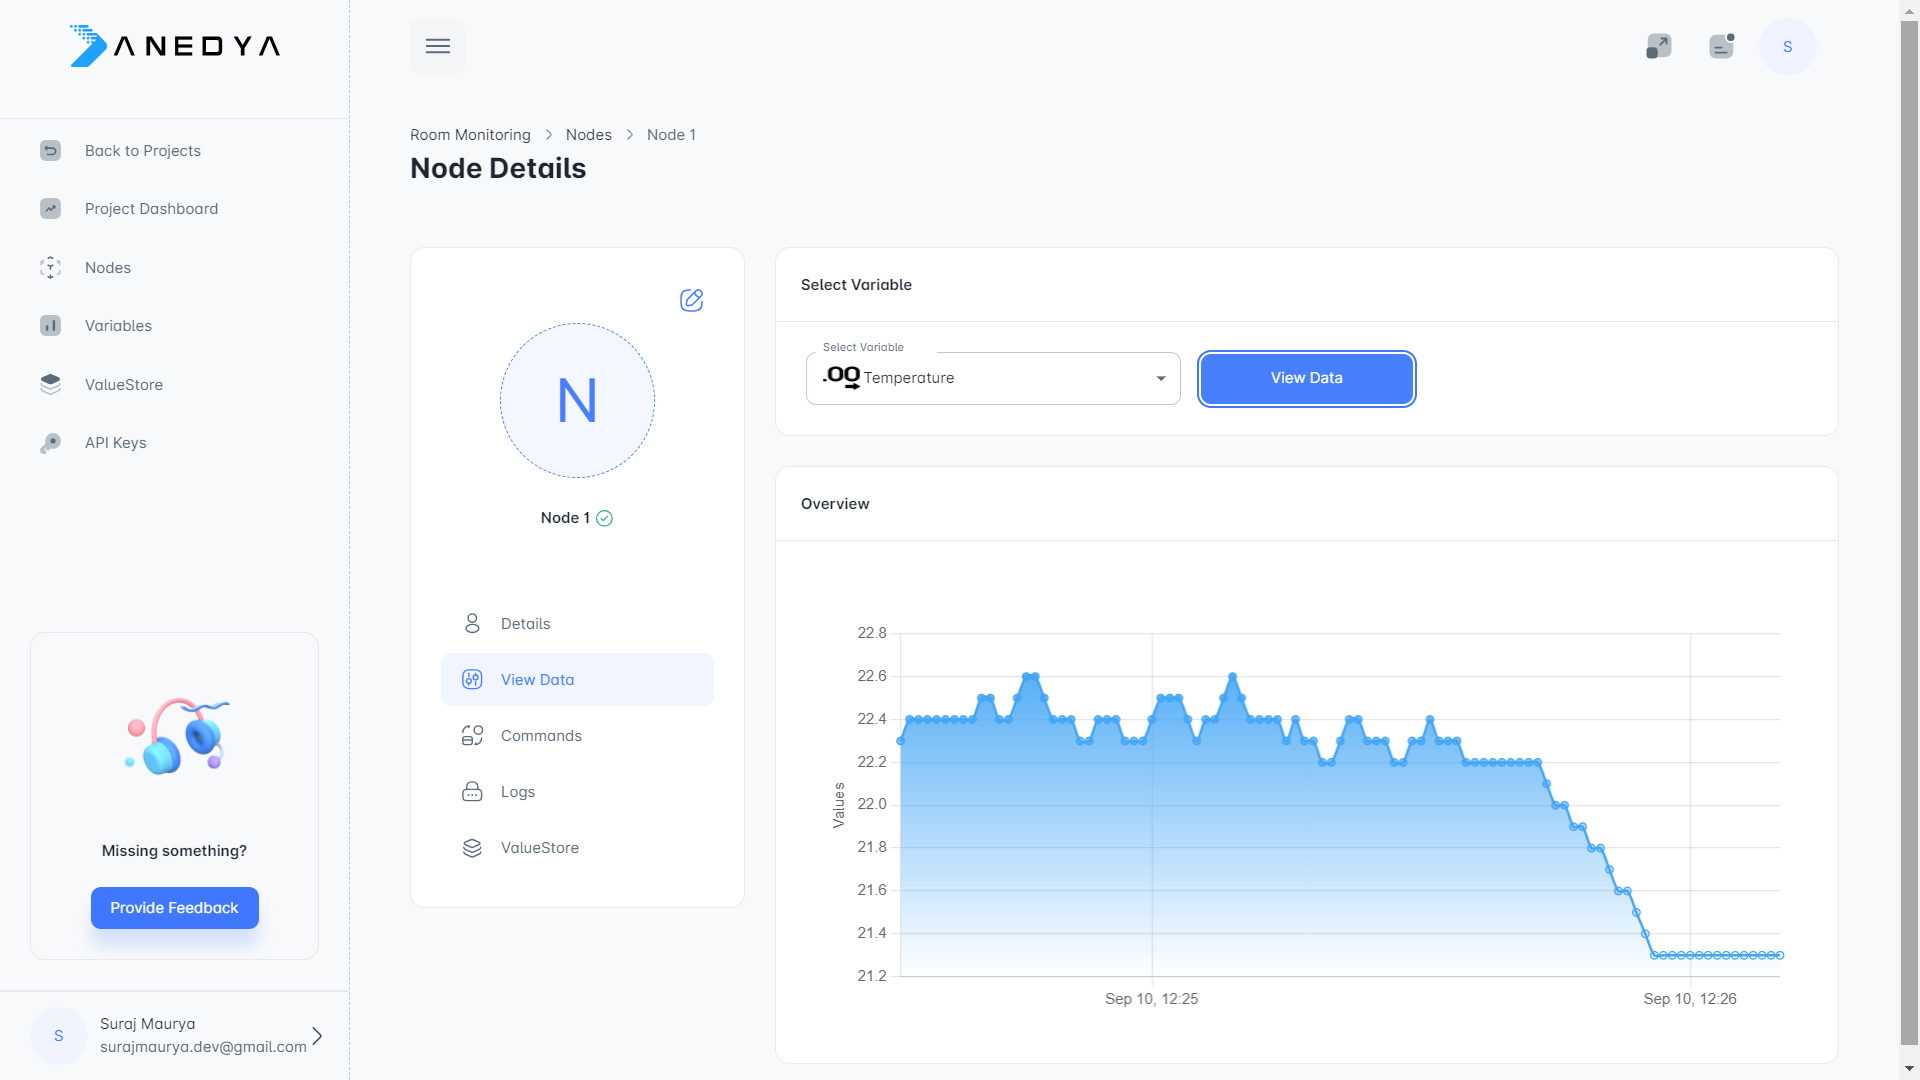
The Anedya dashboard comes with basic visualization functionality. Go to View Data, available through the node's context menu. Select the variable you want to visualize and click View Data to get a nice graph showing the last 100 data points submitted by your device.
